Strategic Comparative Analysis of Traditional Diesel and Solar-Powered Lighting Towers
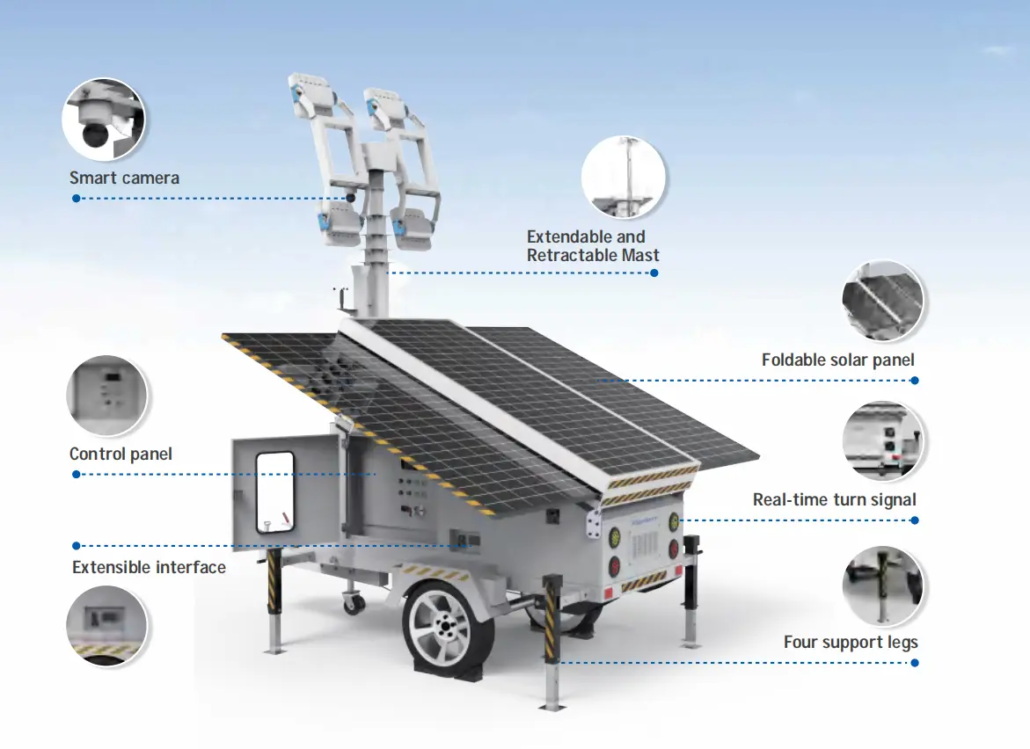
Component Comparison and Specifications The following data characterizes the standard hardware configurations for both classes of lighting assets, illustrating the […]