Solar prison perimeter lighting Guidelines
As a professional streetlight manufacturer with 20 years of experience in outdoor special venue lighting design, Luxman has formulated this […]
As a professional streetlight manufacturer with 20 years of experience in outdoor special venue lighting design, Luxman has formulated this […]
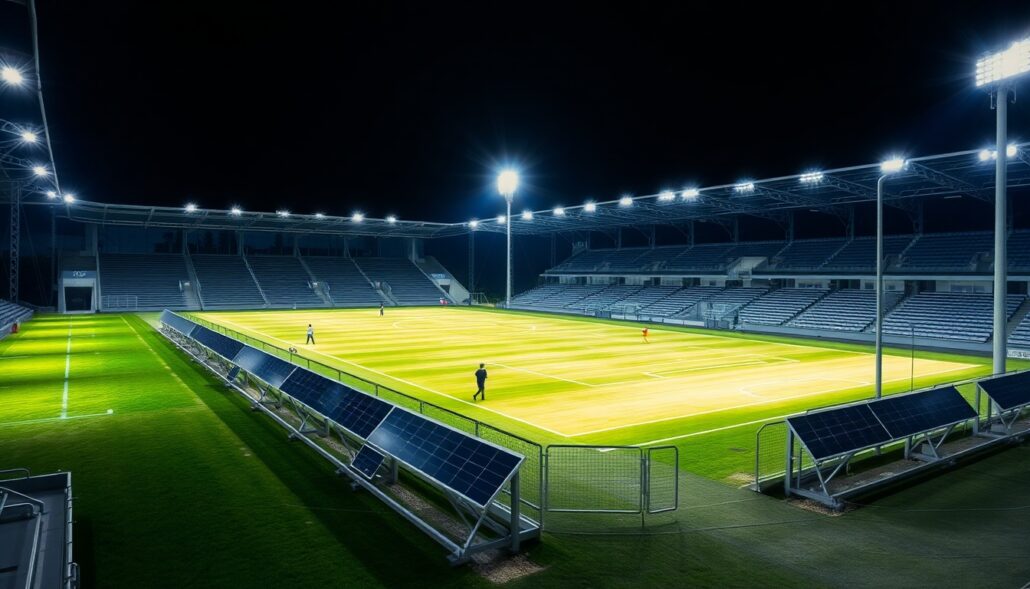
1. Overview and Design Objectives The lighting design for sports venues is a complex system engineering task that must meet

When selecting an aluminum flagpole, understanding the unique requirements of different heights and applications is crucial. From residential 6-foot decorative

Luxman is a leading manufacturer of aluminum telescopic flagpoles, offering durable, lightweight solutions ideal for various applications, from residential to

1. Overview of Aluminum Flag Poles Definition & Advantages Aluminum flag poles are commonly made of extruded/welded aluminum alloy or
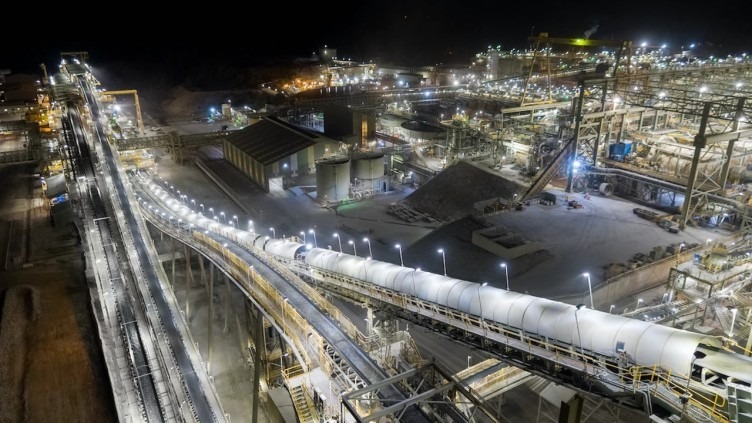
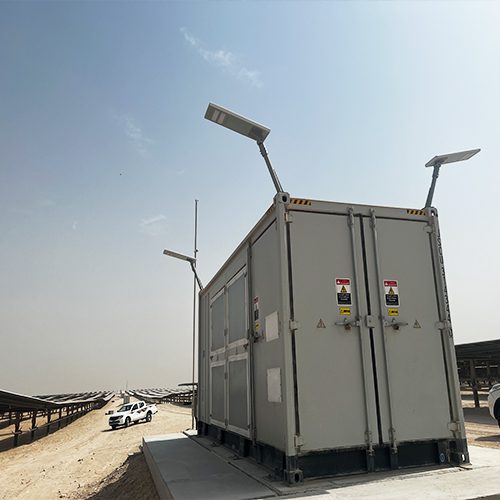
1. Background and Significance of Solar Light Towers in Saudi Arabia With a hot and dry climate, abundant dust, and
1. Standards Compliance This proposal strictly follows the Saudi standard SASO 2927:2019 (Road Lighting Energy Efficiency and Functional Requirements). This
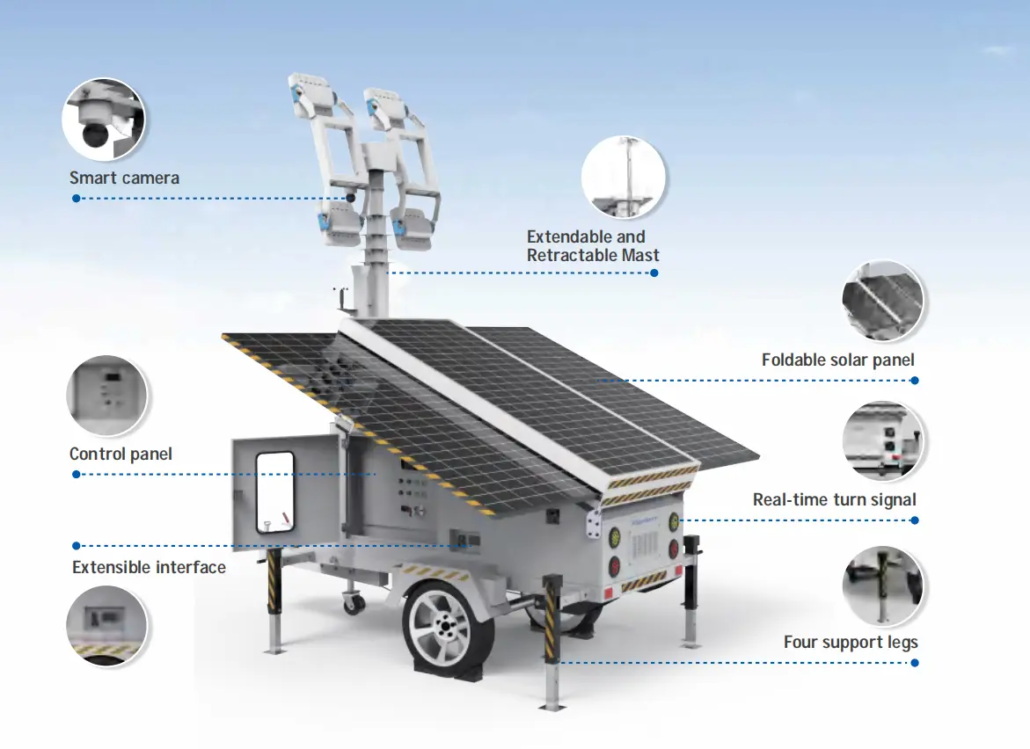
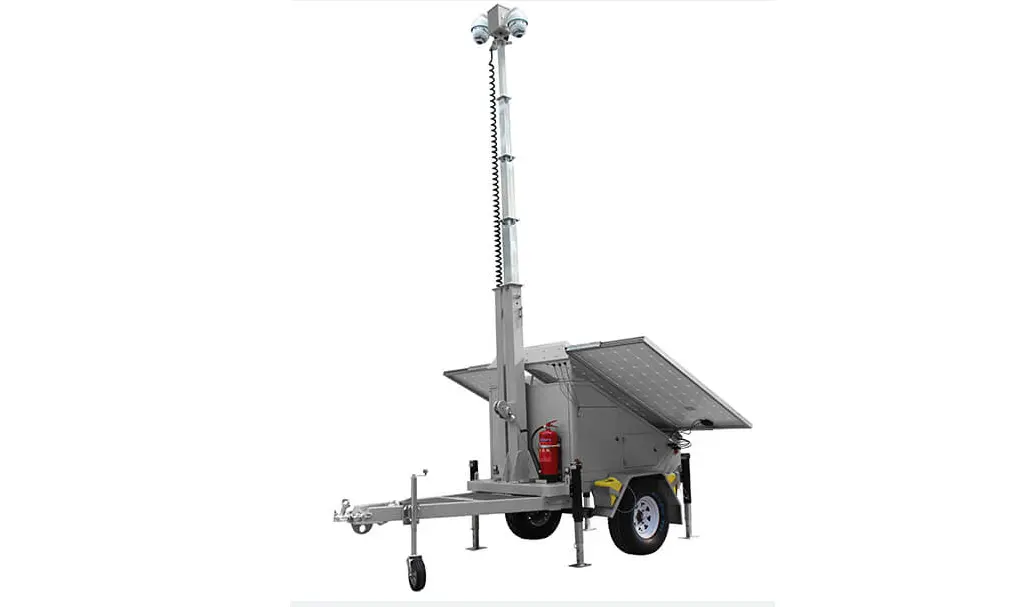
What are the definition and working principle of light towers Concept and Function: Light towers are integrated high-level lighting systems,
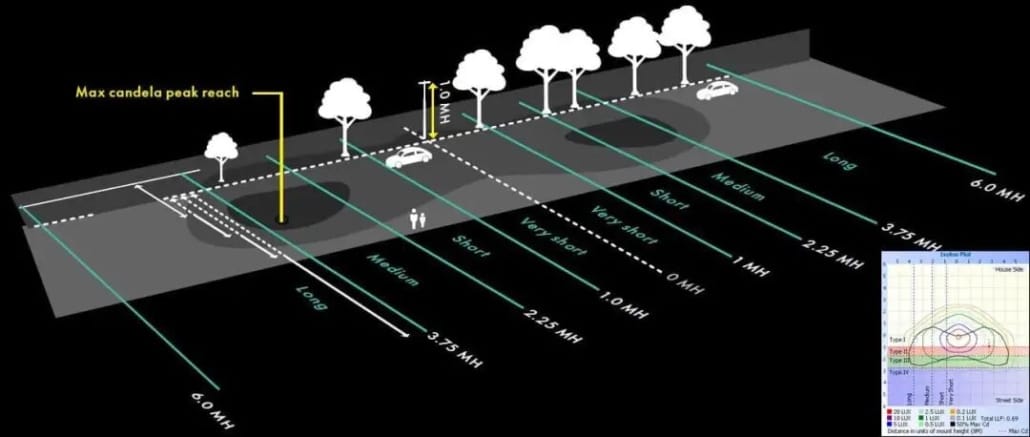
The light distribution of LED fixtures refers to the distribution, direction, and intensity of light emitted by the fixtures. It
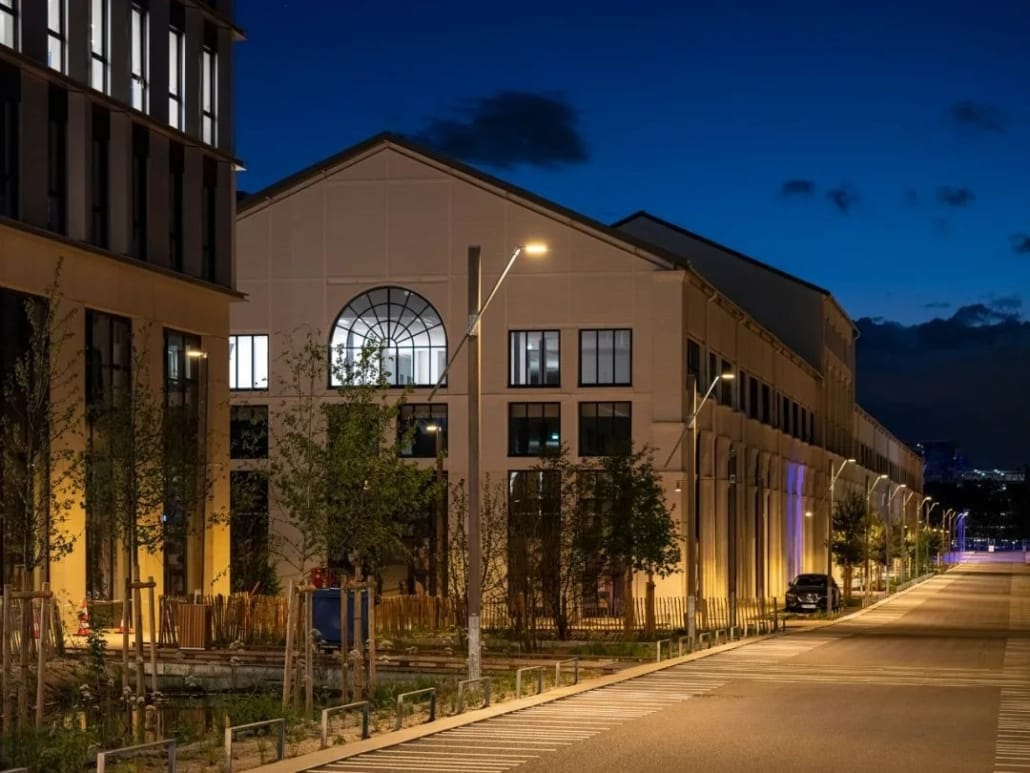
1. Introduction Outdoor lighting design is a complex discipline that surpasses simple spatial illumination; it profoundly influences public safety, visual